
Hello, I really like Stride3D engine, but after spending few minutes in template demos (third person platformer / fps shooter), memory consumption go high as crazy and does not stop until force quit or lack of system memory.
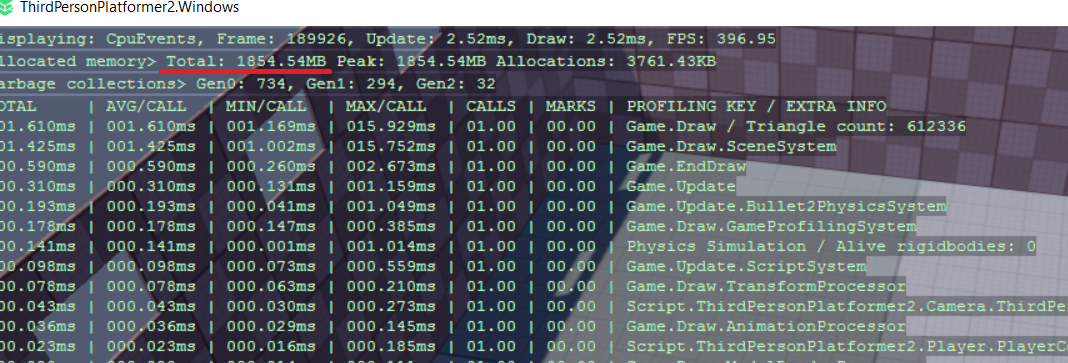
In 3rd person template example, it is from ~100MB at startup, to 2GB after maybe 5 minutes of walking/jumping or even just standing or total inactivity and RAM increase.
Is it some kind of glitch, or it has something to do with C# garbage collection for such low-level stuffs(low level graphics API, Engine Core…) and handling all of that low level things in such high-level language become mess for GC?
Can I somehow handle memory management on my own? And will it even help? Or problem is somewhere else?
I really like Engine and want to use it, but I am unsure if it is worth to spend time learning it with lack of documentation, if it has such crucial performance issue in build-in template samples on my PC.
Thanks for answers.
Does this also happen when you export the game and run the exe?
Is it on first run (which might compile a lot of shaders with our quite memory-inefficient shader compiler)?
If yes, interested to see how much memory is used during the second run.
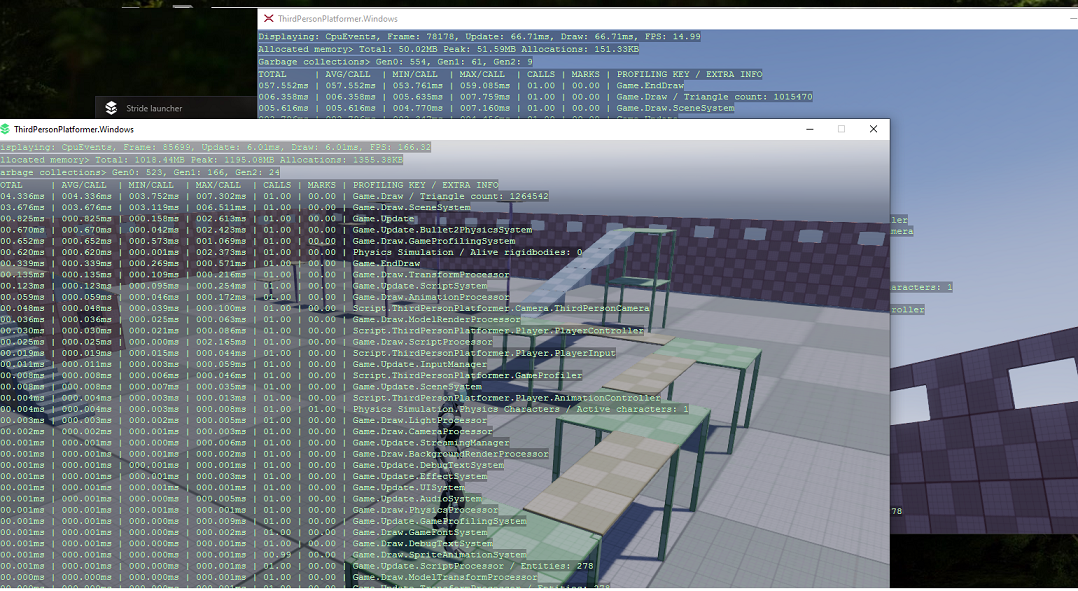
I tried it in editor build, VS Debug/Release and from generated .exe and it happens in all scenario. Even tried on my second PC and same thing happens.
It occurs in latest beta version of Stride 4.0. (beta 04-1265).
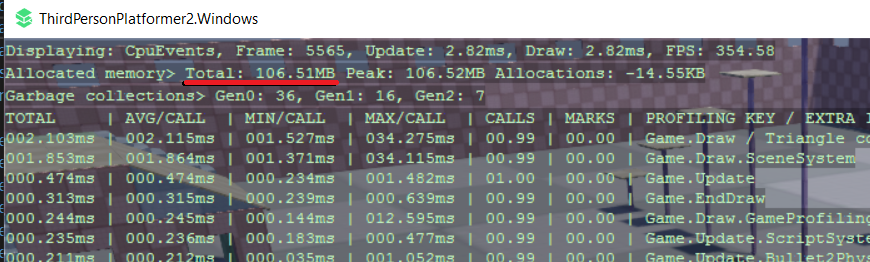
I installed Xenko 3.1, and memory allocation is perfectly stable.
In same scenario (little bit of running/jumping and standing in ThirdPersonPlatformer demo) Stride beta version consumed ~1GB of RAM and Xenko 3.1 version remained same ~50MB as it started.
I would like to help finding where the issue is, but It will be difficult for me as I do not know nothing about Stride architecture yet. But I think, that you will encounter same issue in latest beta version as I did in my both PCs.
Thanks for the investigation… Very interesting.
Studio 4.0.0.1-beta04-1265 (.NET Framework 4.8.4220.0)
Target: Win 10 1803 Build 17134
Min: Win 10 Fall Creators Update Build 16299
TopDownRPG template
Release x64 Windows + Game Profiler: Memory leak present. Fps uncapped (~400).
Release x64 UWP + Game Profiler: Memory leak not present. Fps capped to monitor refresh (75).
I’ve opened an issue for this, looks like it is related to my pull request for instancing, I’ll have a look at it: